How it works
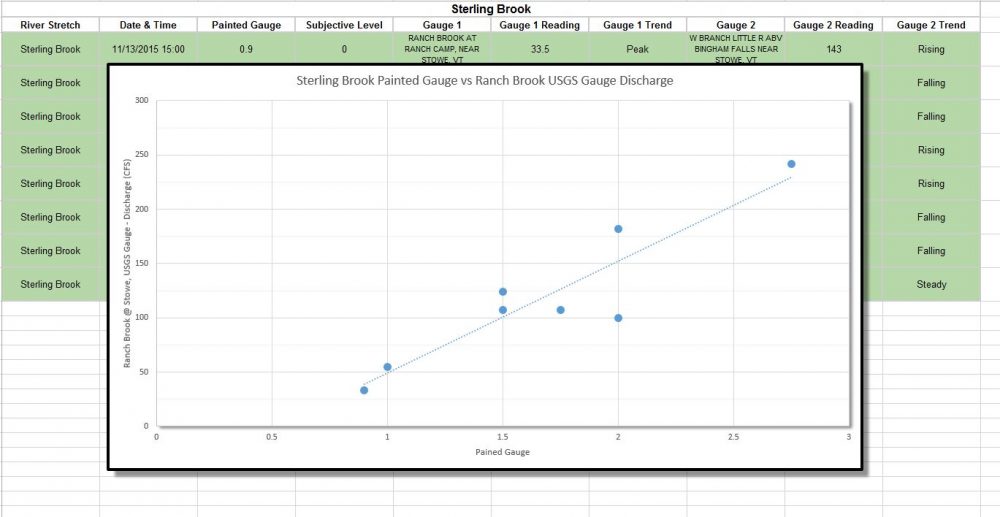
The idea is simple. Gather as many reports as possible for the purpose of correlating USGS river gauge readings to optimal levels on our favorite runs. We are already putting these correlations to work on the flows page to output real time river information based on the data collected here. A huge thanks to those who have contributed. As of 2021 we are over 400 reports on close to 50 different rivers. The more we gather, the better the correlations will become.
All we ask of you is the following:
1. Make note of a visual level of your favorite creek noting the date and time.
2. Submit that information via the form provided below.
Like we said – simple. You can submit level information from your river logs as far back as you like, just so long as you can estimate as close as possible to the actual time of the visual.
Here is an example:


